Welcome to the home of Farm Financial Standards Council
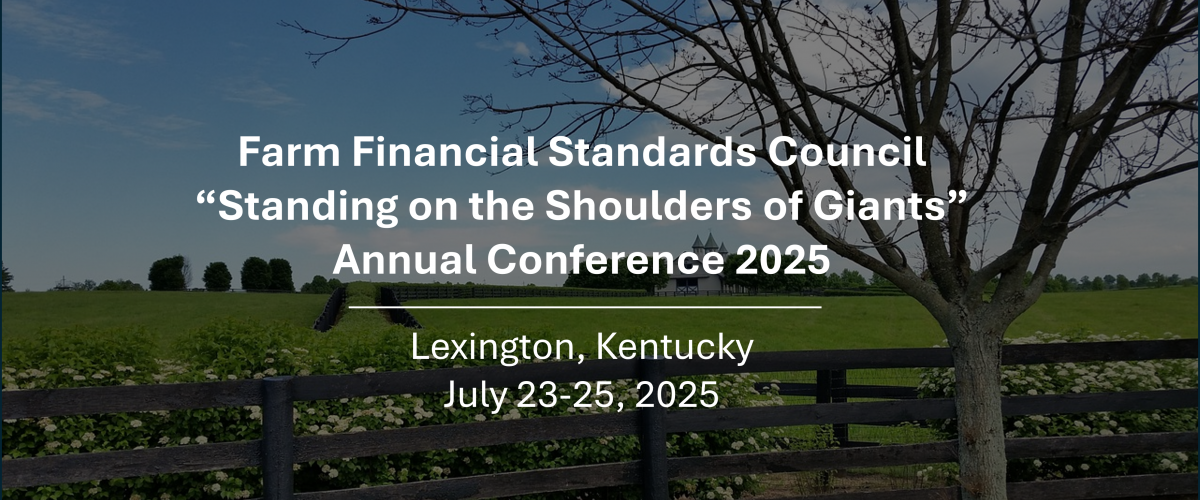
Upcoming Conference!
Join us for our upcoming conference, “Standing on the Shoulders of Giants,” on July 23-25 in Lexington, Kentucky!
Engage with industry leaders, network with peers, and learn from esteemed speakers.
We can't wait to see you there!
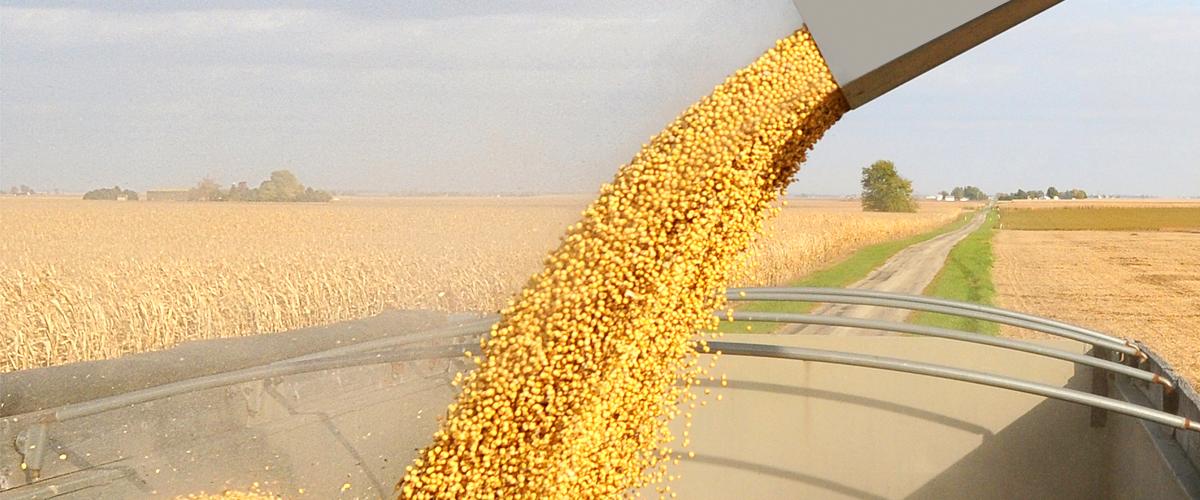
The Farm Financial Standards Council is dedicated to helping farmers by promoting uniform financial reporting and analysis in the ag industry. We are the definitive resource for financial guidelines that benefit farmers.
Become A corporate Partner
Click here or tap the icon above to learn more.
Become A Member
- Participate in Council Committees
- Eligibility to stand for election to the Board of Directors and/or officer positions
- Discount off published registration rate for the Annual Conference
- Automatic and complimentary updates on Financial Guidelines for Agriculture and Management Accounting Guidelines for Agriculture
Contact us
Latest News
Addendum to Farm Financial Standards Council’s Loan Assistance White Paper
Council Members Elect New Officers
Annual Conference 2024
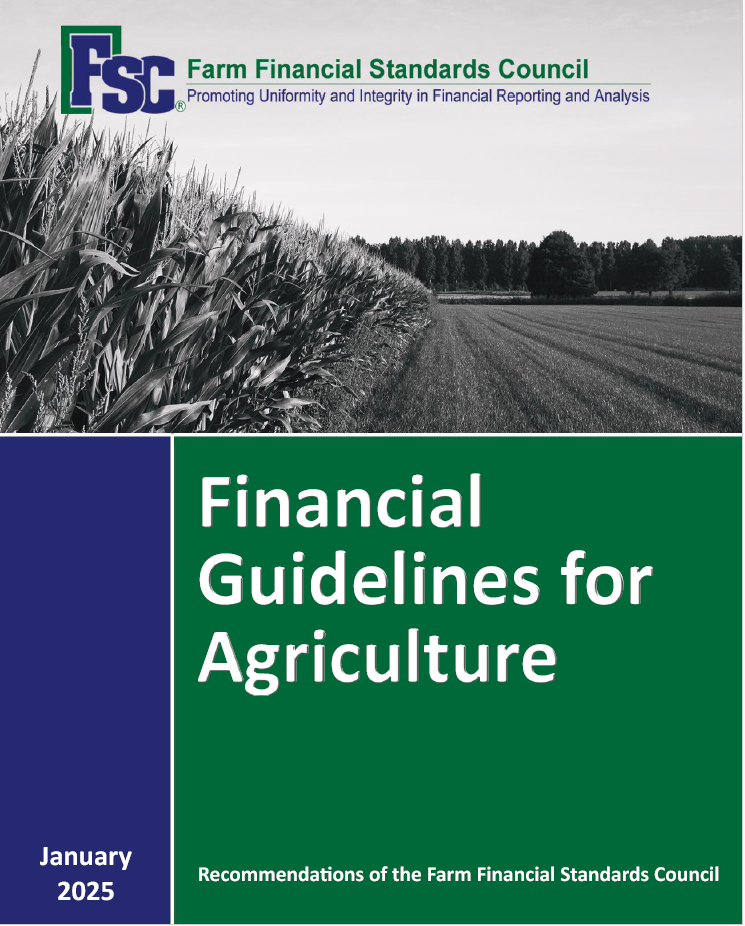
Financial Guidelines
The Financial Guidelines for Agricultural Production provides recommended standards for format and content of financial reports, recommended financial measures common to all sectors of agriculture, and example statements and measures.
Cost: $50
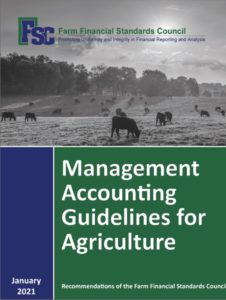
Management Guidelines
The Management Accounting Guidelines for Agricultural Production responds to the ever-increasing need for consistent, reliable, and accurate management information systems to support day-to-day production decisions.
Cost: $50